



A single salon or spa can often run on daily sales, appointment counts, and manager intuition. A franchise cannot. Once a brand adds locations, providers, service lines, memberships, inventory, marketing campaigns, and franchise reporting needs, leadership needs a tighter KPI system.
That system should do more than show what happened last month. It should help operators see where revenue grows, where demand leaks, where staff capacity gets wasted, and which locations need support. U.S. franchising is projected to grow from 832,521 to 845,000 establishments in 2026 (International Franchise Association). IFA also projects $921.4 billion in franchise output and nearly 8.9 million franchise jobs in 2026 (International Franchise Association). Labor remains central to salon and spa operations. BLS projects 84,200 annual openings for barbers, hairstylists, and cosmetologists from 2024 to 2034 (Bureau of Labor Statistics). BLS also projects 14,500 annual openings for skincare specialists and 24,800 annual openings for manicurists and pedicurists over the same period (Bureau of Labor Statistics, Bureau of Labor Statistics).
For salon and spa franchise KPIs, the goal is not to track everything. The goal is to track the few metrics that help headquarters and local operators make better decisions faster.
Why KPI tracking gets harder as salon and spa franchises grow
Every new location adds more than revenue potential. It adds staff schedules, rooms, stations, service menus, booking rules, retail inventory, memberships, local promotions, and client records. If each location tracks those areas differently, headquarters loses the ability to compare performance in a fair way.
That is why a strong KPI framework starts with consistent definitions. Revenue per ticket should mean the same thing in every location. Calendar utilization should use the same formula across the network. Membership conversion, lapsed clients, cancellation rates, and retail performance should follow shared reporting rules.
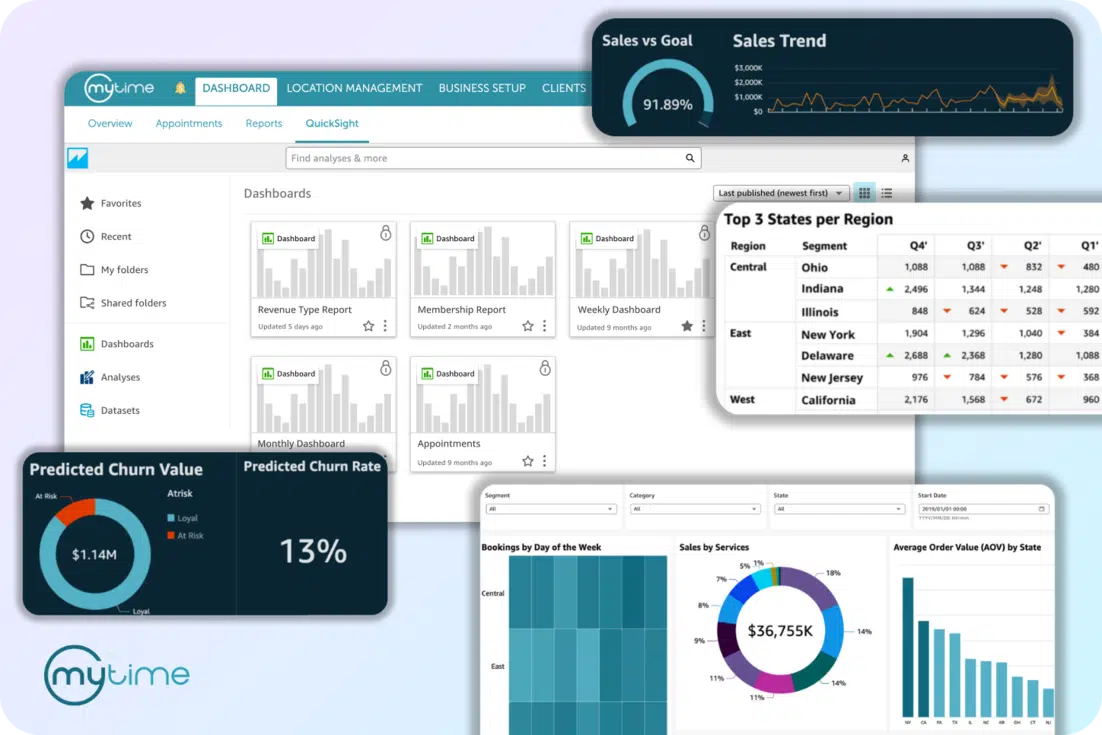
MyTime helps franchise teams create that shared view by connecting operating data across the business. Its franchise solution gives home office staff tools to track metrics, royalties, and subscription management across franchisees (MyTime Franchise). Leaders can also see revenue, tickets, and activity at the franchisee group or location level (MyTime Franchise). MyTime offers more than 70 adaptable reports that teams can filter by location, service, and staff (MyTime Reports & Analytics).
The KPI categories salon and spa franchises should track
Salon and spa franchises do not need one massive dashboard that overwhelms the team. They need a practical scorecard that links each metric to a decision.
| KPI category | Metrics to track | What it helps you decide |
|---|---|---|
| Revenue health | Gross revenue, net revenue, revenue per ticket, revenue by service, product revenue, membership revenue, package revenue, gift card revenue | Which revenue streams drive growth and where performance needs attention |
| Demand and booking | Appointment volume, booking source, bookings by day and time, waitlist demand, cancellations, no-shows, walk-ins, pre-booked rate | Where demand comes from and where the schedule leaks revenue |
| Utilization and capacity | Calendar utilization, booked hours, scheduled hours, room usage, open time, peak-period fill rate | Whether staff, rooms, and resources match real demand |
| Staff productivity | Sales per hour, service sales per hour, product sales per hour, average ticket value, tickets, requested appointments, ratings | Which providers need coaching, support, or shared best-practice review |
| Client retention | New versus returning clients, visit frequency, booking interval, lapsed clients, clients without future bookings, referrals, reviews | Whether the brand is building repeat behavior |
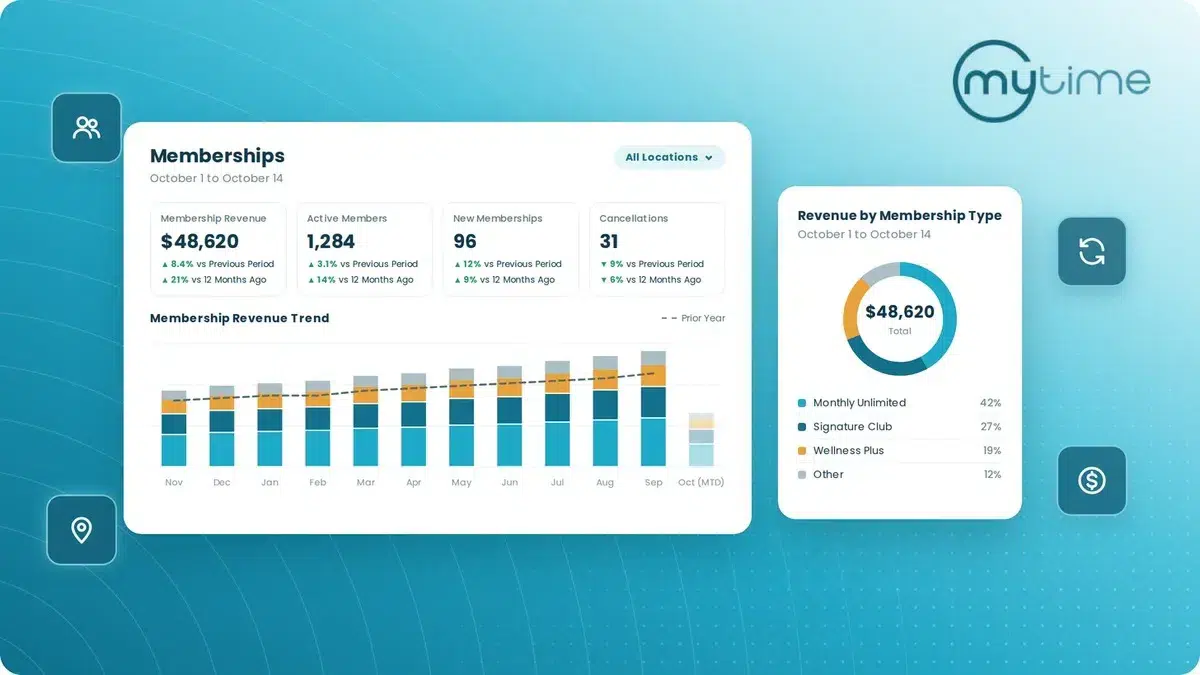
| Membership and loyalty | Active members, new members, cancellations, membership revenue, redemptions, loyalty activity, referral history | Whether recurring revenue programs are working across locations |
| Inventory and retail | Product sales, product revenue per ticket, inventory turns, stockouts, shrink, reorder needs, slow-moving SKUs | Whether retail and back-bar decisions protect margin |
| Marketing performance | Campaign-driven bookings, campaign revenue, promo code usage, flash sale performance, channel source, reactivation | Which campaigns fill schedules and support retention |
| Franchise operations | Location productivity, royalties, reconciliation, disputes, audit activity, benchmark deltas | Which locations need support, governance, or coaching |
MyTime’s Reports Overview supports many of these categories through company, booking, client, staff, point-of-sale, inventory, waitlist, royalty, redemption, and productivity reports (MyTime Reports Overview). That range matters because disconnected tools can scatter franchise KPIs across systems.
Revenue KPIs show what is growing and what is profitable
Revenue sits at the center of every franchise scorecard, but total sales alone can hide the story. A location may grow top-line revenue because it discounts heavily. Another location may look flat, yet improve margin by shifting service mix, increasing retail attach, or growing memberships.
Start with gross revenue, net revenue, revenue per ticket, and revenue by location. Add service revenue, product revenue, package revenue, gift card revenue, membership revenue, discounts, refunds, and redemptions. Then compare those numbers by location, service line, staff member, and time period.
MyTime’s Scheduler App dashboard includes a Revenue tab that displays gross revenue, gross revenue per ticket, and revenue by type (MyTime Dashboard & Reports). The platform also supports previous-period comparisons on reports such as Daily Revenue, Daily Payments, Bookings by Location, and Client Revenue (MyTime Comparing Previous Periods). Teams can compare performance against the previous month, previous year, or both on supported reports (MyTime Comparing Previous Periods).
For franchise leaders, the key question is simple: Which revenue streams can we repeat, and which ones need intervention?
Booking and demand KPIs show where revenue gets won or lost
Booking data shows how clients enter the business. It also shows where the brand loses demand before it becomes revenue.
Track appointment volume, booking source, bookings by day, bookings by time, cancellations, and no-shows. Add waitlist activity, walk-ins, requested appointment rate, and pre-booked appointment rate. These metrics help operators spot channel performance, peak demand, service bottlenecks, and open capacity.
MyTime’s dashboard Bookings tab shows appointment and class volume, appointment status, booking sources, bookings by day, and bookings by time (MyTime Dashboard & Reports). Appointment & Scheduling also supports 24/7 booking, multi-location scheduling, buffer times, and no-show prevention (MyTime Appointment & Scheduling). The same page highlights service and class waitlists, staff availability and certification matching, and multi-provider scheduling (MyTime Appointment & Scheduling).
That combination matters for multi-location brands. When a location has strong demand but weak availability, the team may need staffing changes. High bookings with high no-shows may point marketing and operations toward confirmation and reminder flows. Waitlist growth at specific times can help headquarters adjust schedules, hours, or service capacity.
Utilization KPIs help operators staff to real demand
Utilization shows how well a franchise turns available capacity into booked time. It also helps teams avoid two expensive mistakes: overstaffing slow periods and understaffing high-demand periods.
Track booked hours, scheduled hours, calendar utilization, room or station usage, staff utilization, open time, and peak-hour fill rate. Low utilization may point to weak demand, poor scheduling templates, service mix problems, or excess labor. Very high utilization may signal missed demand, burnout risk, or not enough appointment availability.
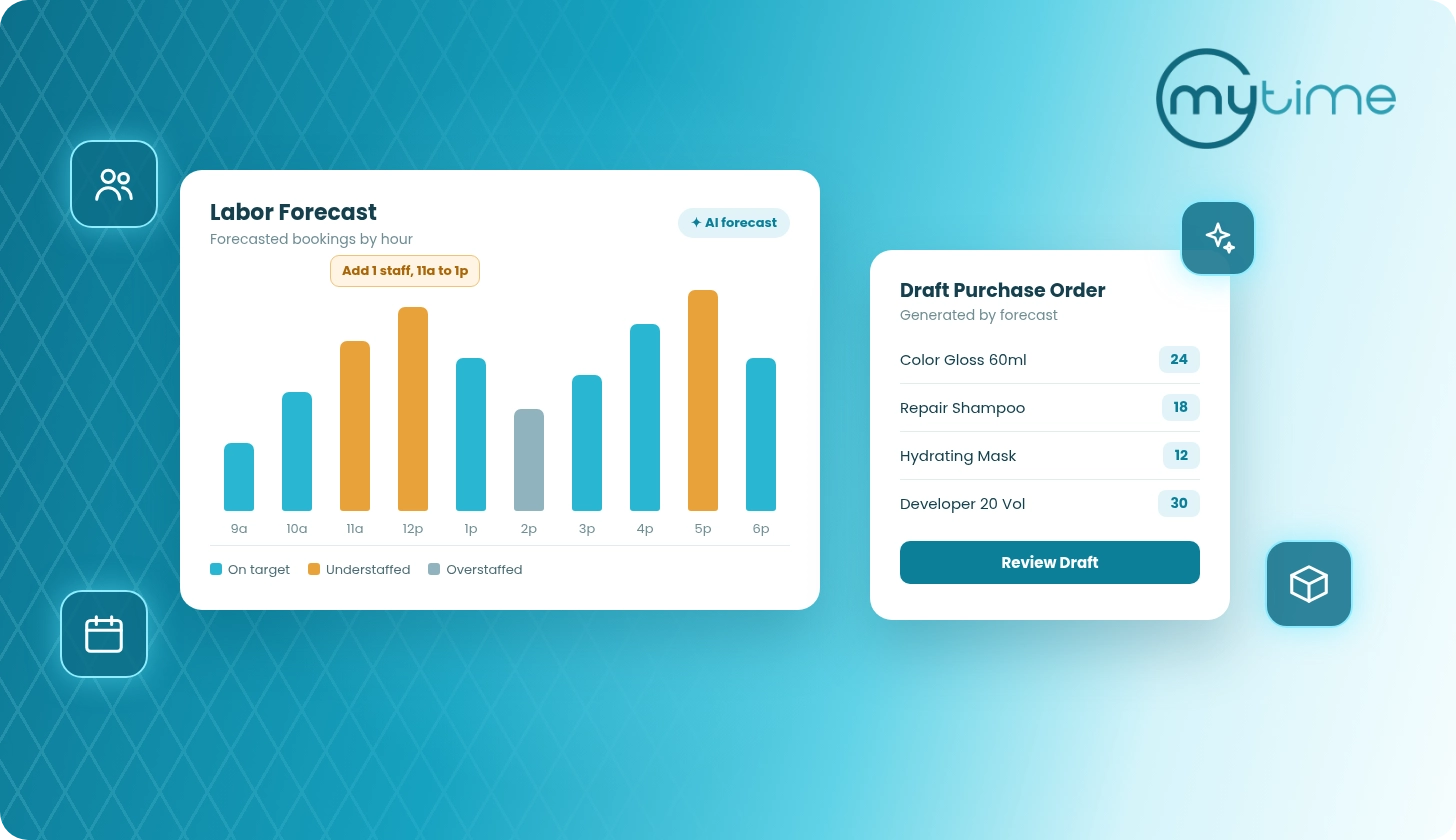
MyTime defines utilization in the Staff Productivity Report as booked hours divided by scheduled hours, multiplied by 100 (MyTime Staff Productivity Report). Labor Forecasting uses historical booking patterns, recent demand trends, provider productivity, and service durations to predict staffing needs by hour (MyTime Labor Forecasting). It also accounts for operating hours and multi-location variability (MyTime Labor Forecasting). This helps brands align staffing to real demand and reduce unnecessary labor spend (MyTime Labor Forecasting).
For salon and spa franchises, utilization should not stand alone. Pair it with revenue per hour, booking source, service mix, and staff productivity. That gives leaders a clearer picture of whether a full calendar creates healthy revenue.
Staff productivity KPIs connect service quality to revenue
Staff productivity should help leaders coach, not punish. A healthy productivity scorecard shows which providers drive revenue, which services need training support, and where top performers can share best practices across the network.
Track sales per hour, service sales per hour, product sales per hour, and average ticket value. Add number of tickets, tickets with services, tickets with products, requested appointment rate, and pre-booked appointment rate. Round out the view with walk-in appointment rate, new client percentage, returning client percentage, ratings, and time since last appointment.
MyTime’s Staff Productivity Report includes sales per hour, product sales per hour, service sales per hour, average ticket value, appointments, and utilization (MyTime Staff Productivity Report). It also includes pre-booked appointment rate, requested appointment rate, walk-in appointment rate, new client percentage, returning client percentage, and time since last appointment (MyTime Staff Productivity Report). The Reports Overview adds staff reports for appointment history, productivity, ratings, tips, daily compensation, time tracking, staff scheduling, calendar utilization, membership conversion, and audit reporting (MyTime Reports Overview).
Franchise teams should review productivity with context. A provider who handles longer or more specialized services may generate fewer tickets but higher service value. Another provider may excel at retail attach or rebooking. The right KPI view helps leaders understand those differences instead of flattening every role into one average.
Client retention KPIs show whether growth will last
New clients help a salon or spa grow. Returning clients help a franchise become durable.
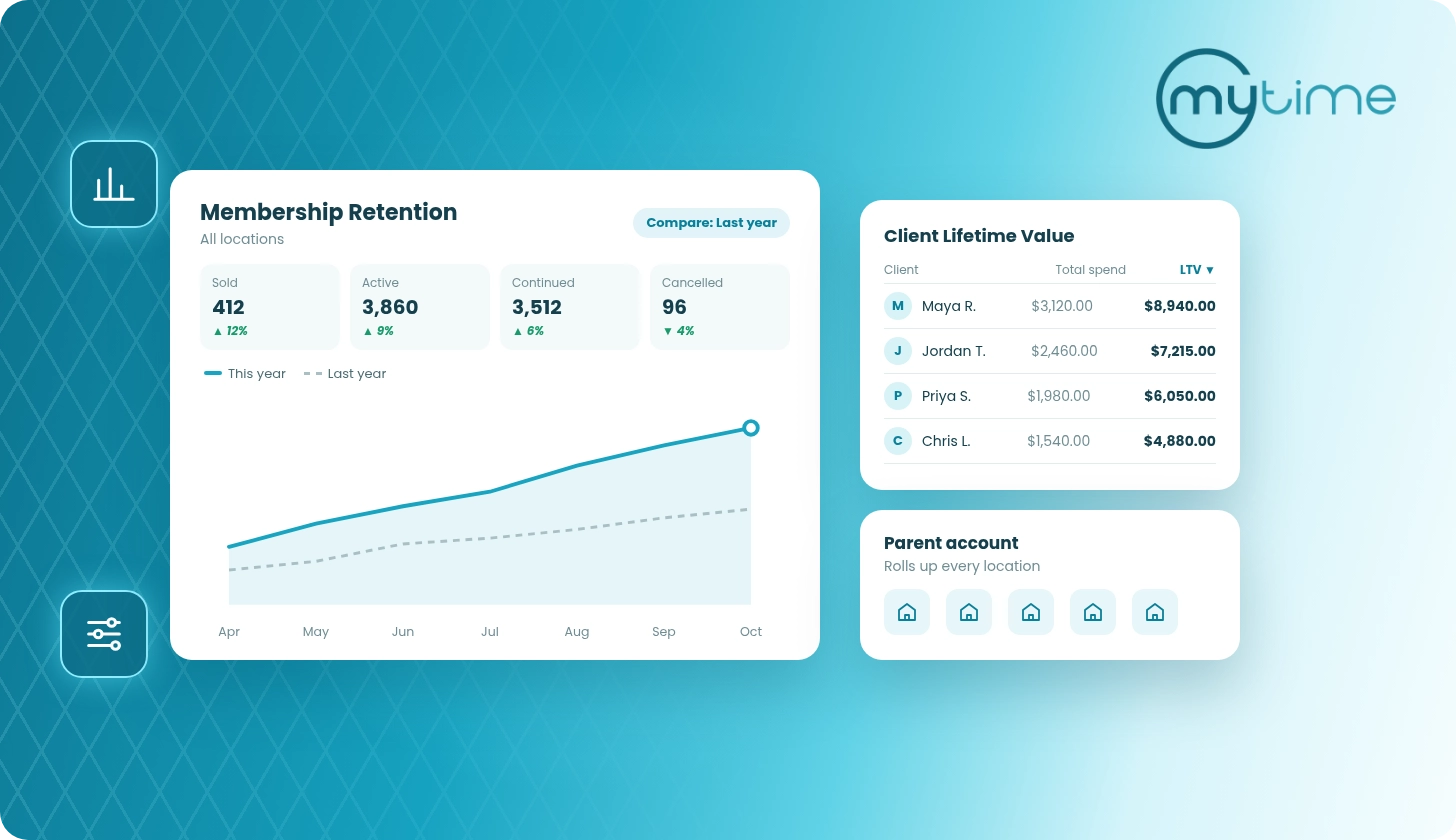
Track new versus returning clients, visit frequency, booking interval, lapsed clients, clients without future bookings, referrals, reviews, and lifetime value. Review those metrics by location, service line, provider, campaign, and membership status.
Clean client data matters because retention metrics break when records fragment across locations. MyTime defines a global client record as a unified profile shared across all locations (MyTime Clean Client Data). That profile can include appointments, packages, memberships, waivers, payments, and communications in one centralized place for authorized staff (MyTime Clean Client Data). Clean client data supports consistent service, accurate reporting, and effective client engagement across every location in the network (MyTime Clean Client Data).
A retention dashboard should help teams act. When visit frequency drops after a first appointment, review the rebooking process. Lapsed-client clusters around certain services may point to experience or follow-up issues. Global profiles help staff recognize loyal clients who visit multiple locations.
Membership, package, gift card, and loyalty KPIs make revenue more predictable
Memberships, packages, gift cards, loyalty programs, and referrals can turn occasional visits into more predictable relationships. They also add reporting complexity because revenue, payment, redemption, and usage may happen at different times.
Track active members, new members, canceled members, membership revenue, recurring payment success, and failed payments. Add membership conversion, package balances, gift card balances, gift card activity, redemptions, loyalty activity, referral history, and top referrers.
MyTime supports configurable memberships for franchise and multichain requirements, flexible payment options, and membership management from client profiles (MyTime Memberships, Packages, and Gift Cards). Package tools can secure upfront revenue, support client loyalty, create smoother scheduling experiences, and improve resource utilization (MyTime Memberships, Packages, and Gift Cards). Gift card tools support selling, reloading, and tracking gift cards across in-store, online, and guest app channels (MyTime Memberships, Packages, and Gift Cards). Teams can also track gift cards through the Gift Card Activity Report (MyTime Memberships, Packages, and Gift Cards).
MyTime’s predictable revenue guidance explains that memberships can smooth cash flow and increase visit frequency (MyTime Predictable Revenue). The same resource notes that memberships can improve retention and give leaders clearer visibility into future revenue (MyTime Predictable Revenue). That makes membership and loyalty KPIs useful for franchise leaders who want steadier revenue across locations.
Inventory and retail KPIs protect margin and service delivery
Inventory KPIs often get less attention than revenue or bookings, but they can have a direct impact on margin and client experience. Too much inventory ties up cash. Too little inventory can disrupt services and reduce retail sales.
Track product sales, product sales by SKU, product revenue per ticket, inventory turns, stockouts, and shrink. Add inventory adjustments, reorder needs, back-bar usage, slow-moving products, and purchase order reconciliation. Then review those metrics with service demand and promotion calendars.
MyTime Inventory Forecasting uses historical usage patterns to predict future product needs (MyTime Inventory Forecasting). It also accounts for vendor lead times and target stock periods, then calculates how much needs to be ordered and when (MyTime Inventory Forecasting). The inventory forecasting article notes that multi-location brands need to avoid excess inventory that ties up cash (MyTime Inventory Forecasting). It also notes that brands need to avoid stockouts that interrupt services and reduce revenue (MyTime Inventory Forecasting).
Inventory data gets more useful when teams connect it to booking trends. If one location sells more retail after specific services, other locations can learn from that service flow. If a product turns slowly everywhere, the brand can adjust purchasing or promotions.
Marketing KPIs should connect campaigns to bookings, retention, and utilization
Marketing KPIs should not stop at opens and clicks. For salon and spa franchises, the better question is whether campaigns create booked appointments and fill underused capacity. Strong campaigns should also reactivate lapsed clients and support membership or package growth.
Track campaign-driven bookings, campaign revenue, promo code usage, flash sale performance, booking source, and reactivation. Add lapsed-client response, SMS usage, segment performance, and location-level campaign results. Review those metrics with utilization so marketing does not drive demand into already-full calendars while other time slots sit open.
MyTime Marketing Hub supports email, text, and push campaigns (MyTime Marketing Hub). It also supports targeted campaigns based on appointment history and client tags, audience segmentation, and analytics to track campaign performance (MyTime Marketing Hub). Marketing Hub can target promo codes and flash sales by location, service, or staff, which can help teams fill schedule gaps (MyTime Marketing Hub).
For headquarters, the most useful marketing dashboard compares campaign performance across locations. That view helps the team see which offers, segments, services, and timing patterns drive action.
Franchise operations KPIs create accountability across locations
Franchise leaders need KPIs that help them compare locations without losing local context. A strong franchise operations dashboard should show location productivity, revenue, utilization, royalties, redemptions, reconciliation, payment disputes, audit activity, and benchmark deltas.
MyTime’s franchise page states that each franchisee location feeds into analytics and reporting (MyTime Franchise). That gives leaders granular visibility into what works and what does not (MyTime Franchise). The same page calls out productivity, revenue, and utilization tracking across and by location (MyTime Franchise). Built-in reports can also break down revenue, productivity, and performance by location, service, or staff member (MyTime Franchise).
That level of visibility helps corporate teams focus support where it matters. One location may need staffing help. Another may need retention support. A third may outperform the system on memberships and provide a playbook for the rest of the network.
Turn KPI reporting into an operating rhythm
A KPI framework only works if teams review it consistently. The best salon and spa franchises turn reporting into a simple operating rhythm.
- Daily: revenue, bookings, cancellations, no-shows, utilization, staffing gaps, waitlist movement, and open tickets.
- Weekly: staff productivity, marketing performance, rebooking, inventory exceptions, lapsed clients, and location scorecards.
- Monthly: location benchmarking, membership trends, service mix, client retention, inventory turns, royalties, and reconciliation.
- Quarterly: network benchmarks, field support priorities, pricing review, service mix review, expansion readiness, and technology gaps.
MyTime reporting can filter insights by location, service, and staff, which supports regular review cycles across the business (MyTime Reports & Analytics). The Scheduler App dashboard also provides location, staff, and date filters (MyTime Dashboard & Reports). It includes Revenue, Payments, Bookings, Services, Products, Clients, and Productivity tabs (MyTime Dashboard & Reports).
Leaders should keep the review focused. A daily huddle should not turn into a monthly finance meeting. A monthly franchise review should not get buried in every individual transaction. Match the metric to the decision and the review cadence.
Why MyTime helps salon and spa franchises act on KPIs
Many systems can produce reports. Salon and spa franchises need a platform that connects KPI signals to the workflows that can improve them.
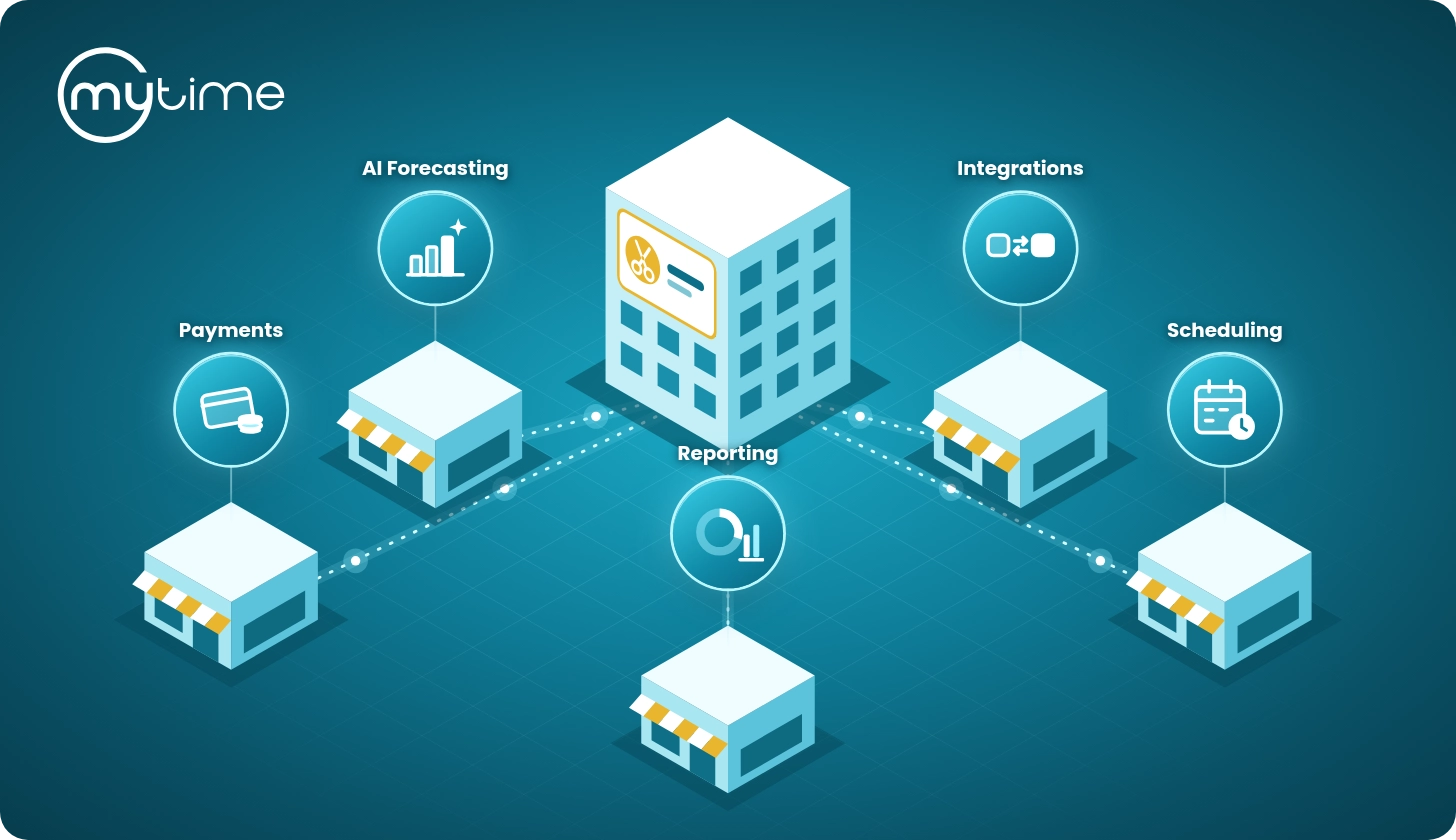
MyTime brings booking, POS, staff, client, marketing, membership, inventory, royalty, reconciliation, and reporting data into one operating platform. Reports & Analytics gives brands visibility into operations, customer engagement, and financial performance across all locations (MyTime Reports & Analytics). The Reports Overview includes company, booking, client, staff, point-of-sale, inventory, membership, loyalty, referral, waitlist, royalty, and audit-related reports (MyTime Reports Overview).
That connected view helps franchise leaders move from “what happened?” to “what should we do next?” When utilization drops, teams can review staffing, booking sources, and marketing campaigns. A retention decline can prompt review of visit frequency, global client data, rebooking, and lapsed-client outreach. Lower retail performance can trigger review of product sales, inventory turns, stockouts, and service mix.
The best KPI system does not just measure performance. It helps the team improve it.
FAQs
What KPIs should salon and spa franchises track?
Salon and spa franchises should track revenue, demand and booking, utilization, staff productivity, client retention, membership and loyalty, inventory and retail, marketing performance, and franchise operations KPIs. MyTime’s Reports Overview includes company, booking, client, staff, POS, inventory, membership, loyalty, referral, waitlist, royalty, and audit-related categories (MyTime Reports Overview).
What is the most important KPI for salon and spa franchises?
No single KPI tells the whole story. Revenue matters, but utilization, retention, staff productivity, and membership performance explain why revenue changes. MyTime’s dashboard includes Revenue, Payments, Bookings, Services, Products, Clients, and Productivity tabs (MyTime Dashboard & Reports). That gives operators a broader view than revenue alone.
How should franchises compare performance across locations?
Franchises should use consistent metric definitions, location-level filters, prior-period comparisons, and peer benchmarks. MyTime supports reporting by location, service, and staff (MyTime Reports & Analytics). Its previous-period comparison feature helps teams compare current results against prior month, prior year, or both on supported reports (MyTime Comparing Previous Periods).
Why do salon and spa KPI reports need clean client data?
Duplicate or fragmented client records can distort retention, visit frequency, membership, loyalty, referral, and marketing metrics. MyTime defines a global client record as a unified profile shared across all locations (MyTime Clean Client Data). That profile can include appointments, packages, memberships, waivers, payments, and communications in one centralized place for authorized staff (MyTime Clean Client Data).
How does MyTime help salon and spa franchises track KPIs?
MyTime connects booking, POS, staff, client, marketing, membership, inventory, royalty, reconciliation, and reporting data in one operating platform. MyTime offers more than 70 adaptable reports and gives teams visibility into operations, customer engagement, and financial performance across all locations (MyTime Reports & Analytics).
Ready to see how MyTime helps salon and spa franchises turn KPI data into action? Book a MyTime demo.